Savor Food Tours
- Seven Apps, One Source of Truth
A key employee left, and the owner asked a better question than "who do we hire?" Seven apps, eighty-seven tables, and one person holding them together by hand. We changed that.
See How It Works →
THE RESULT
Cross-business information available instantly,
in plain English.
The Challenge
Every system worked. The person in the middle was the only thing joining them.

A cornerstone employee who wore five different hats left a void that was difficult to fill. The obvious next move was to post the job. The owner, asked a better question first: do we actually need to replace her? She suspected, correctly, that much of the role wasn't judgment or expertise. It was a person acting as the connective tissue between a constellation of apps and services that didn't talk to each other.
This was a team already ahead of most on AI, and they'd hit the ceiling everyone hits. The AI could draft a customer support email in their voice, but it needed a human to answer basic seat availability or policy questions. It could sum the gross ticket sales if they dropped in an export file, but it couldn't compute profit because it didn't have fixed-cost or commission data from Quickbooks. The company's facts lived in seven apps, eighty-seven tables, and dozens of spreadsheets. A single customer could exist in half a dozen different places. Simple questions, like how many guests ever booked twice, had gone unanswered for three years. The tools were fine. There was nothing true for them to read.
What We Built
One place where every fact lives together, connected to AI the whole team can question.

One Source of Truth
Ten databases unified into a single warehouse, cleaned up and connected. Customers who existed in seven places under seven spellings are now one customer, with one history.

Updates Itself
Twice-daily refreshes, and new bookings land within seconds. Nobody on the team logs into it, manages it, or maintains it. No new app to learn, no new seat to buy.

Ask in Plain English
Connected to Claude. "Who's on tomorrow's 10am tour?" returns the roster with dietary flags attached. From where the owner sits, that's the entire product.

Finds What You Already Own
Three years of bookings became one revenue curve. Signed waivers became eight thousand guest records with mailing addresses: a remarketing asset they'd paid for and never used.
Useful for Internal Team Members Too
Questions that used to mean exports, a spreadsheet, and a Thursday afternoon. Open one to see what comes back.
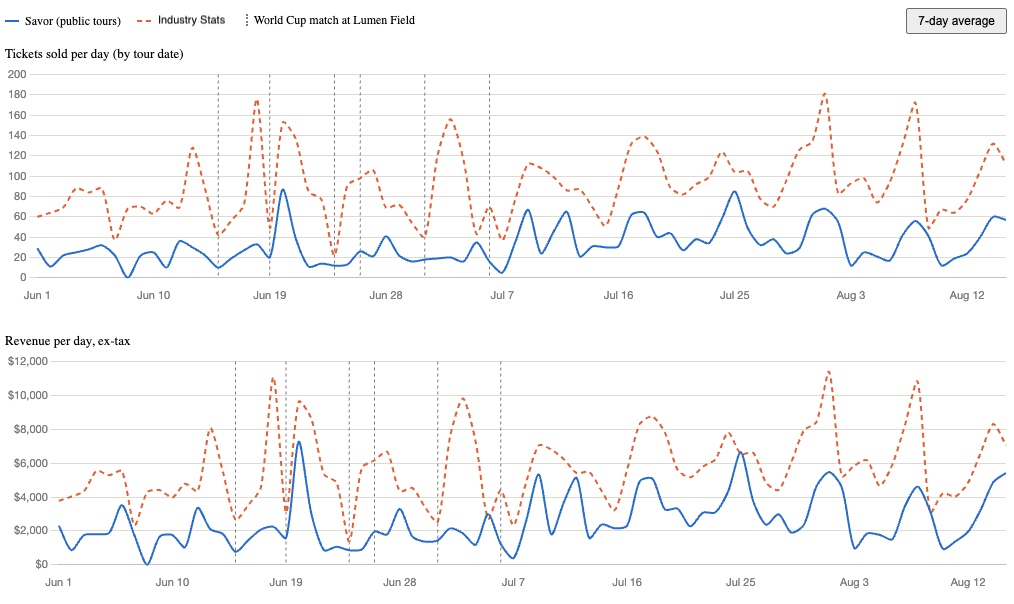
Are the World Cup games responsible for the dip in ticket sales?
A chart showing Savor's sales with the World Cup games highlighted against industry trend data for the same period
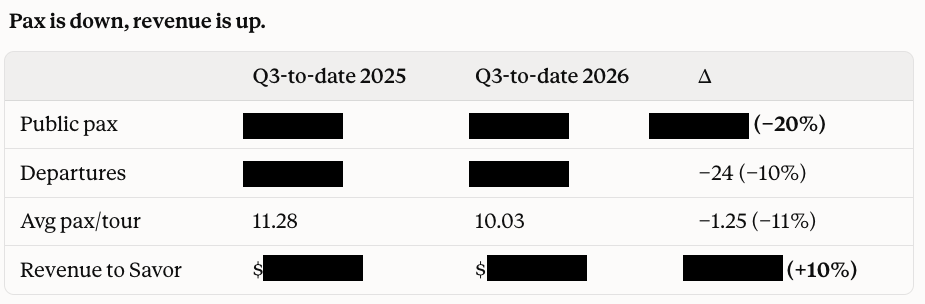
Did sales go down when we raised prices last month? If so, did net profit actually increase?
Passengers down twenty percent, revenue up ten. An actual answer in ten minutes, instead of a question nobody could afford to ask.
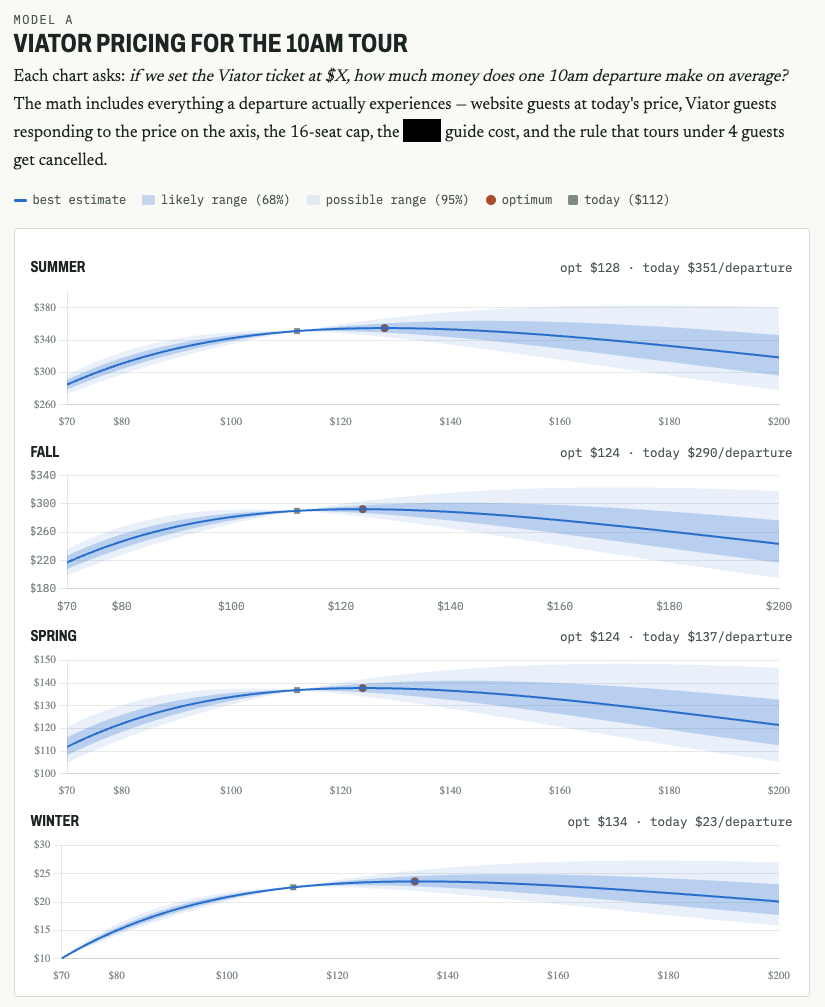
Based on our past ticket prices, adjusted for seasonality, what is the optimal ticket price?
Three findings, two interactive models, one disproven idea, and the decision list for each season.
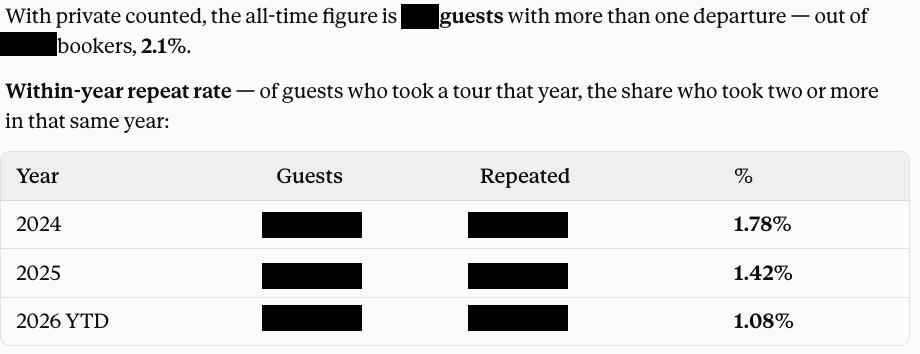
How many guests have booked more than once?
A table, with totals and percentages in seconds.
What Changed
They hired a salesperson instead of reposting a five-jobs-in-one role. The ops-and-admin half of the old job stopped requiring a human
Conversions rates went from 13% to 33%, and for the first time they're making decisions based on data instead of gut instinct
Institutional knowledge no longer walks out the door when a person does
Twenty-six more AI opportunities on their roadmap now have a foundation to stand on
Who's the connective tissue in your business?
Usually excellent, usually expensive, usually the single point of failure nobody has named out loud. We'll help you find the parts of that job that were never really a job.